Visualizing the Energy Transition ...with web applications and maps for desktops and smartphones:
Web App Maps – WAMs.

Map of a German region with colored areas

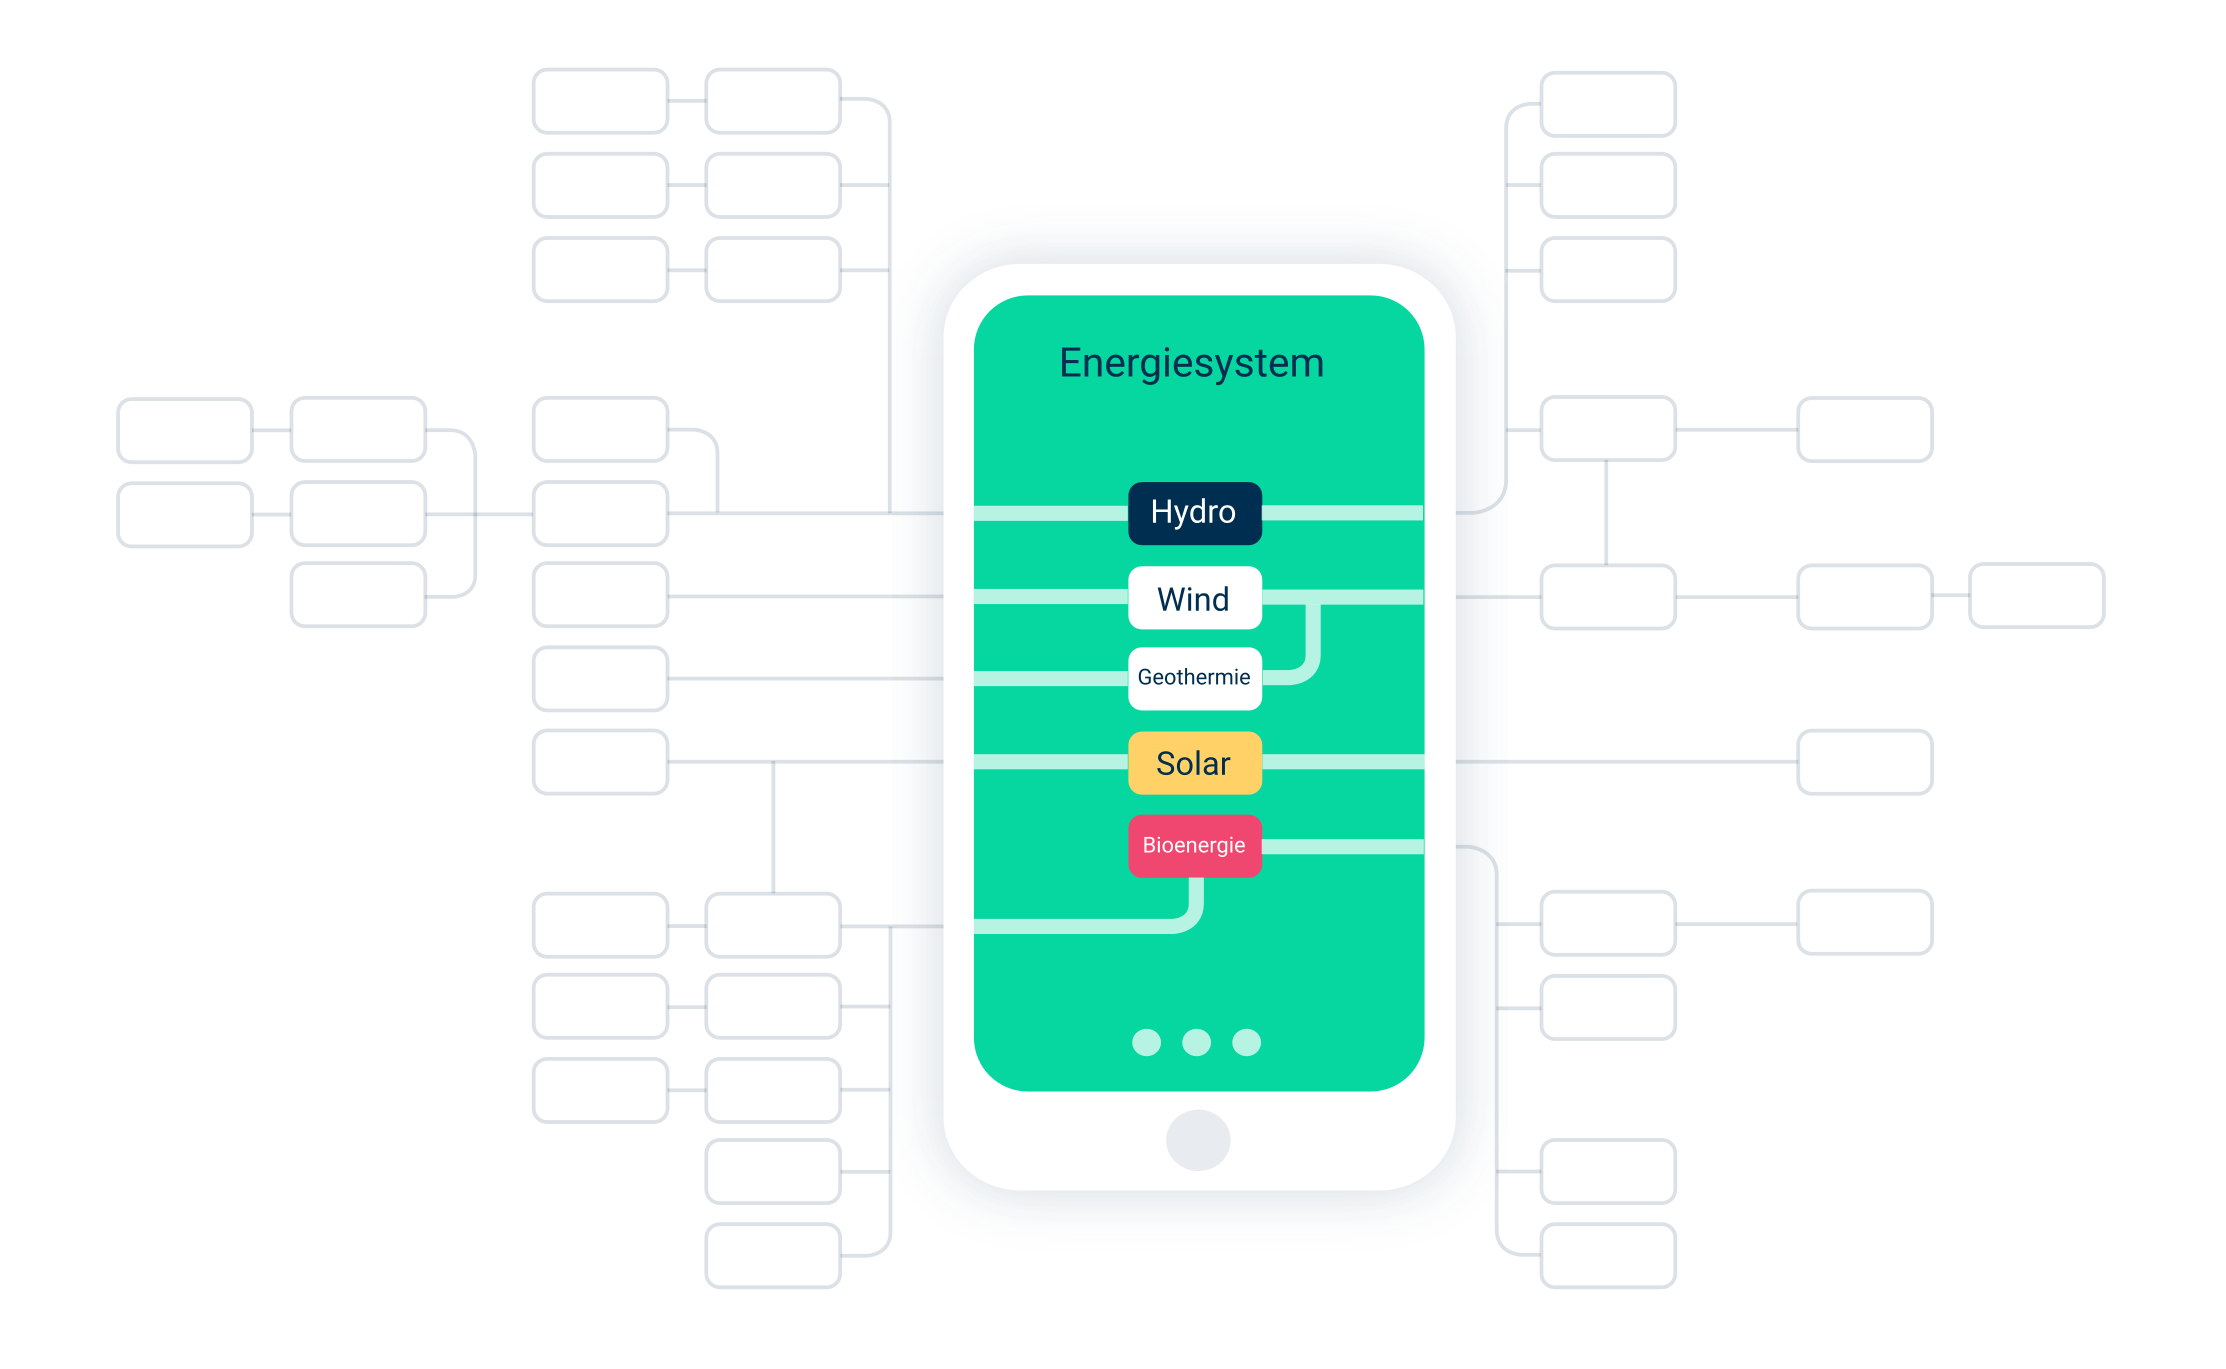
The energy system is complex

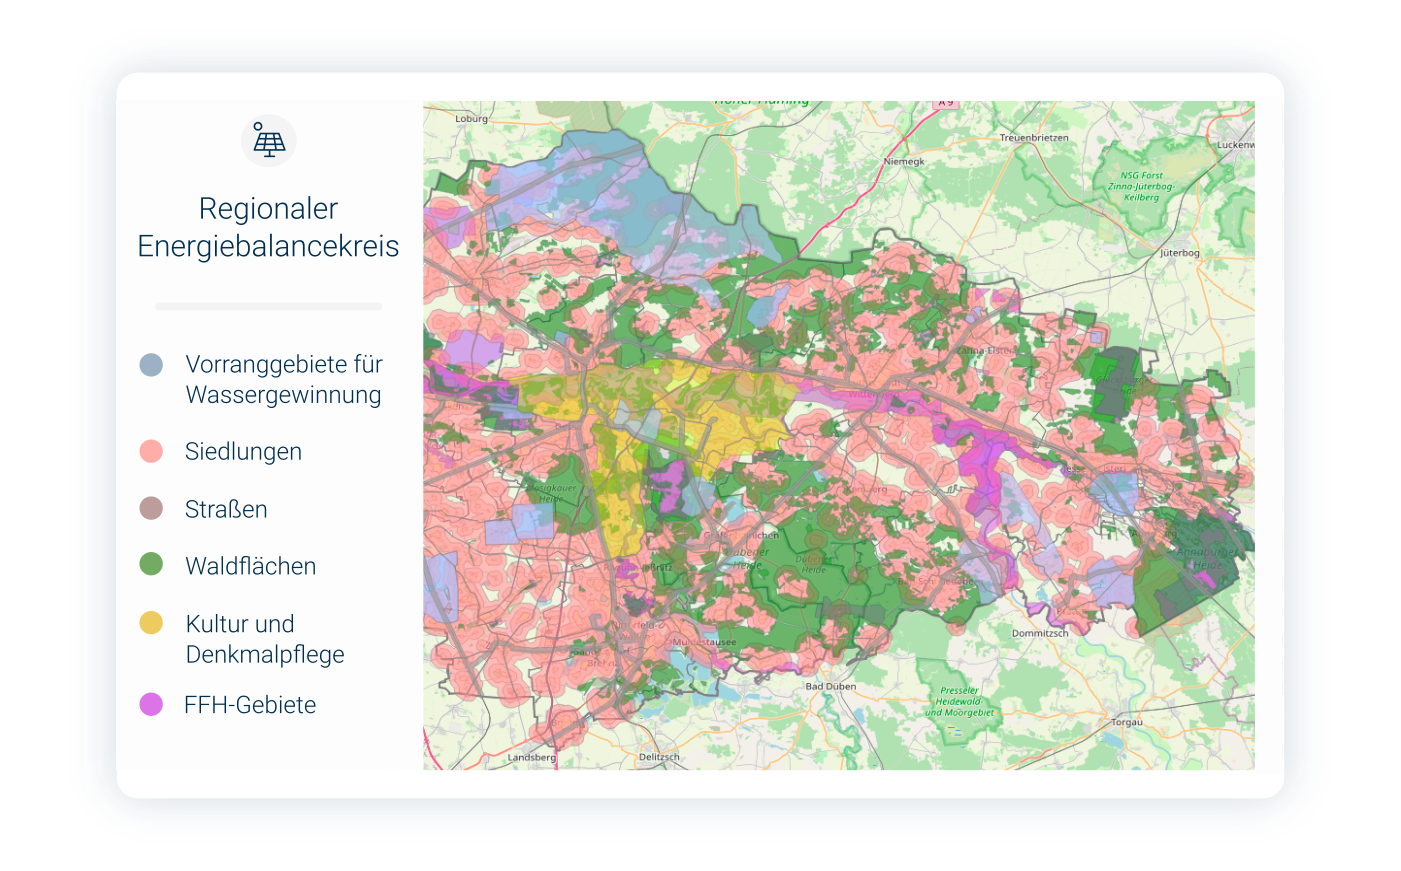
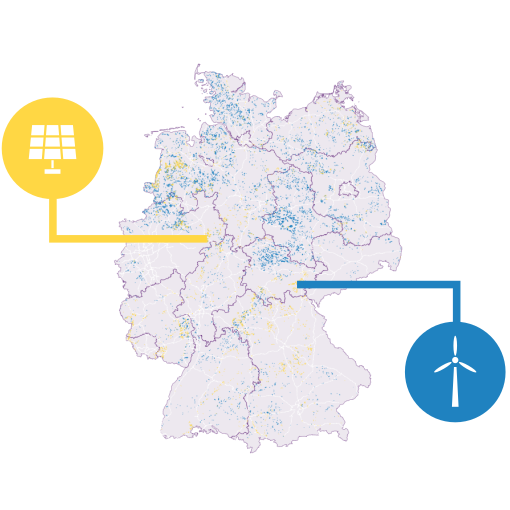
The Energy Transition has many complicated aspects, all of which are interrelated. They are often difficult to communicate to target groups. With web apps, you can reach your target audience. We build them for you.

Contact us
The energy system is presented more easily with a web app
Map of a German region with colored areas

Maps give you complex data at a glance

WAMs help to keep track of large amounts of data. For example, with interactive graphics, maps, or quizzes.

The web applications involve your target group

WAMs help directly engage stakeholders on-site or from home. Reactive visualizations are understandable for anyone.

Illustration of mobile users and three different devices

Example Projects

Photovoltaics and Wind Area Calculator

The web tool commissioned by the German think tank Agora Energiewende shows which areas in Germany can be used as wind potential areas or for the installation of photovoltaic systems.

DigiPlan Anhalt

DigiPlan Anhalt - the further development of the StEmp tool Anhalt-Bitterfeld-Wittenberg.
Map tool for regional transformation in the context of the energy system and land use.

NESP2

Website with interactive maps to support electrification planning under the Nigerian Energy Support Programme II (NESP II).

StEmp-Tool Anhalt-Bitterfeld-Wittenberg

Interactive stakeholder empowerment tool for citizen participation. It simulates future energy systems of the region with consumption and generation.

StEmp Tool Heat – Mecklenburg

Stakeholder empowerment tool for citizen participation. It creates scenarios for cost-effective and environmentally friendly heat supply in people’s own neighborhood.

E-MetroBus

Playful Webapp for the smartphone commissioned by BVG (Berlin public transport company). Quiz and Information about e-mobility in public transport.

Off-grid potential in Tanzania

Online map for interactive analysis of off-grid electrification potential in Tanzania.

We implement your project

The WAMs are partly developed in research projects, and partly produced directly on behalf of energy transition actors.

Contact us
Mobile device with UI and energy components
Illustration of different charts and sliders on desktop and mobile

Scientific methods are comprehensible

WAMs are based on real models and data from research. They help to make scientific processes transparent and comprehensible. They are built by energy transition experts, software developers, and open-science enthusiasts with a lot of know-how.

Scientists free data

As scientists of the Reiner Lemoine Institute, we want to free the data from their tables. Our team of energy transition professionals, software developers, and open-source enthusiasts is convinced that the best way for people to understand the energy transition is for them to play with consumption and generation figures.

Various charts of energy performance on a desktop screen

Conveying the energy transition

Dashboard with Chart

Visualization

Lightbulb with plant in it

Energy Topics

Joystick

Gamification