Regionaler Energiebalancekreis Anhalt-Bitterfeld-Wittenberg
Szenarien unter dem Aspekt einer abgestimmten Flächennutzung
Good news!
Der Nachfolger dieses Tools - Digiplan Anhalt - ist verfügbar unter: digiplan.rl-institut.de
Ein wichtiger Aspekt zur Erfüllung der Klimaziele für 2050 ist die Partizipation der Bürger und Bürgerinnen. Allerdings erschwert die Komplexität von Energiesystemen und damit verbundenen Fragestellungen den Partizipationsprozess oft erheblich.
Der Szenarienrechner schafft die Möglichkeit, allen interessierten Anspruchsgruppen ein besseres Verständnis über verschiedene Szenarien des regionalen Energiebalancekreises zu vermitteln und die Auswirkungen von Maßnahmen direkt zu ermitteln. Damit wird die Grundlage für eine ebenbürtige Diskussion geschaffen und eine gemeinsame Planung ermöglicht.
Partizipation
Regionale Akteure, insbesondere BürgerInnen, sollen ermutigt werden, seriös und real an der Mitgestaltung der Energiewende in ABW teilzunehmen. Durch anschauliches Design und geeignete Moderation werden die komplexen Zusammenhänge erfahr- und diskutierbar.
Effizientere Arbeitsweise
Die regionale Energiewende kann mit besser verhandelten Ergebnissen effizienter vorangetrieben werden. Es wird, in der Gesamtheit, eine bessere Planung und Genehmigung von erneuerbaren Energieanlagen ermöglicht.
Tieferes Verständnis
Dieses Tool wird nicht nur dabei helfen, die Zusammenhänge zwischen verschiedenen Systemen der Energiewirtschaft, Ökologie und Kulturlandschaft besser zu erklären, auch die Interessen und Werte der regionalen Anspruchsgruppen werden sichtbar gemacht. Das gegenseitige Verständnis wächst - auch und gerade bei unterschiedlichen Meinungen.
Open Science
Daten und Quellcodes werden für alle Interessenten bereitgestellt. Das schafft Transparenz und Überprüfbarkeit. Zudem kann die Umsetzung ähnlicher Tools somit erleichtert werden.
Wie funktioniert das Tool?
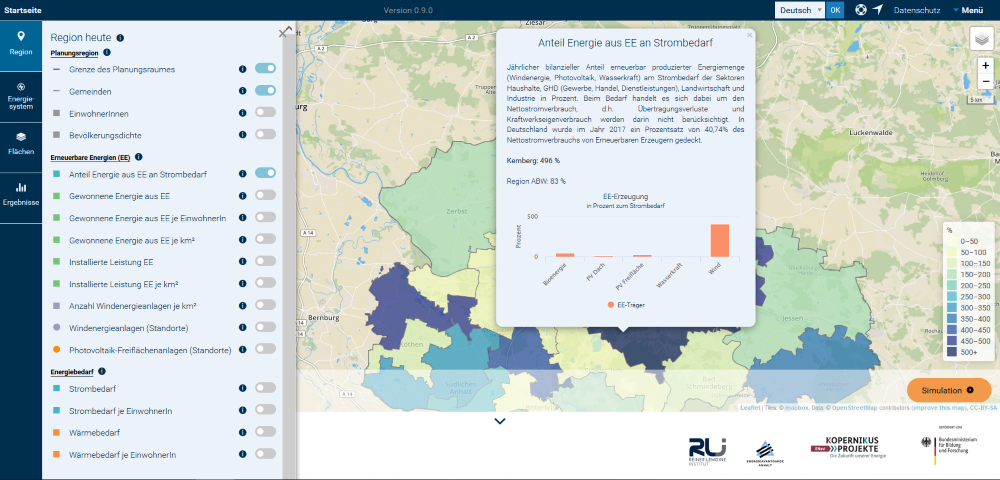
- Wieviele Menschen leben in den Gemeinden?
- Wieviel Strom kommt aus Erneuerbaren Energien?
- Wieviele Windkraftanlagen stehen in den Gemeinden?
- Welcher Flächenbelastung entspricht das?
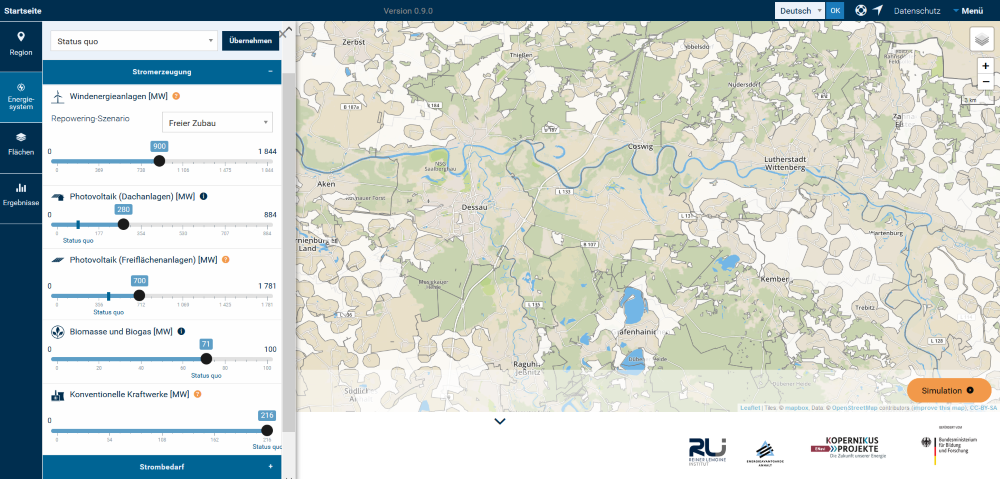
- Untersuche das Energiesystem der Region
- Wähle ein Zubauszenario für Windenergie
- Variiere den Anteil von Windenergie- Photovoltaik- und Biomasseanlagen oder konventionellen Kraftwerken
- Passe den Verbrauch der Region an
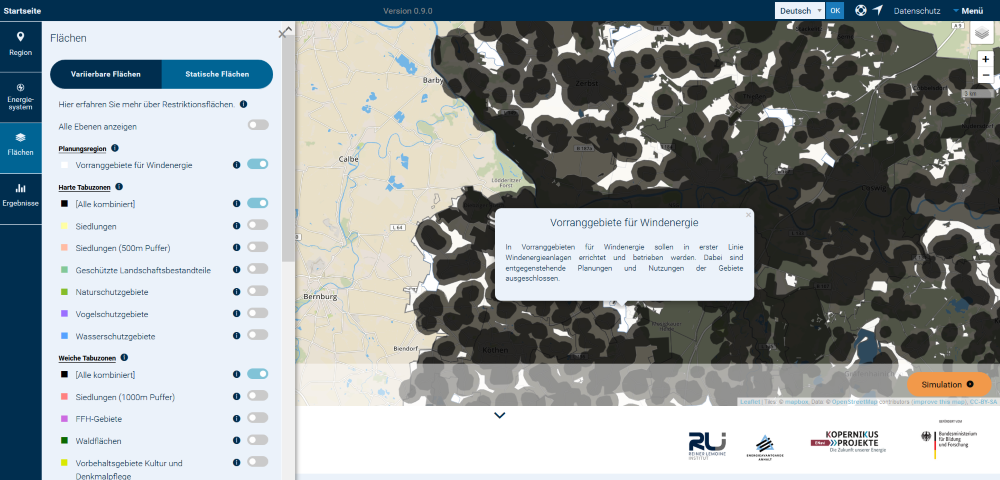
- Sieh dir vorhandene Vorrangflächen für Windenergie an
- Sieh dir die Tabuzonen für Windenergie in der Region an
- Entscheide ob der Mindestabstand zu Siedlungen verändert werden soll, um mehr Windenergieanlagen bauen zu können
- Entscheide ob Waldgebiete zum Bau von Windenergieanlagen zur Verfügung stehen sollen
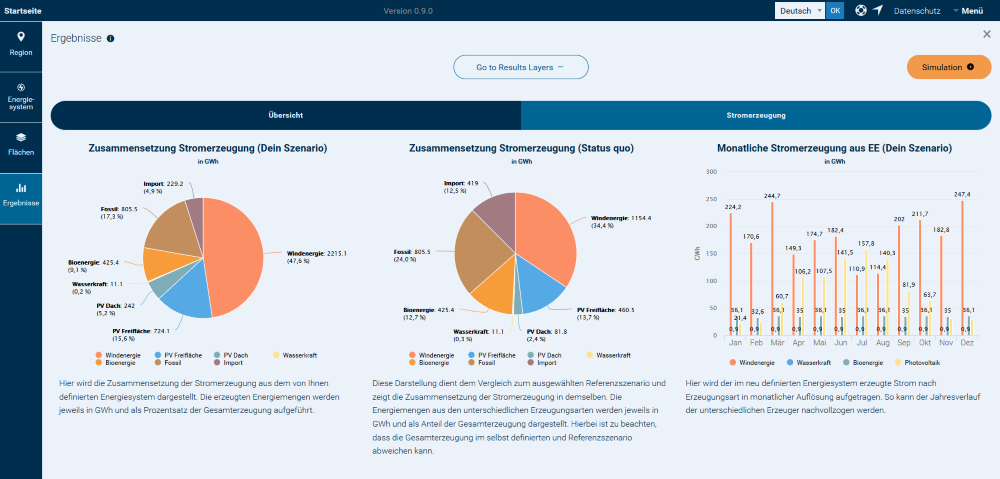
- Beobachte die Auswirkungen in der Karte und auf die mögliche Stromerzeugung des Energiesystems
- Wie verändert sich der Anteil Erneuerbarer Energien in den Gemeinden und der Region?
- Wie viele Windkraftanlagen pro km² kommen hinzu?
- Wie verändert sich der Im- und Export von Strom?
Get involved!
Dokumentation
Weitere Informationen und Hintergründe finden Sie in unserer Dokumentation auf ReadTheDocs.
Quellcode
Der Quellcode ist auf GitHub unter der Lizenz GNU AGPL v3 frei verfügbar.